Sweetener Comparison Chart
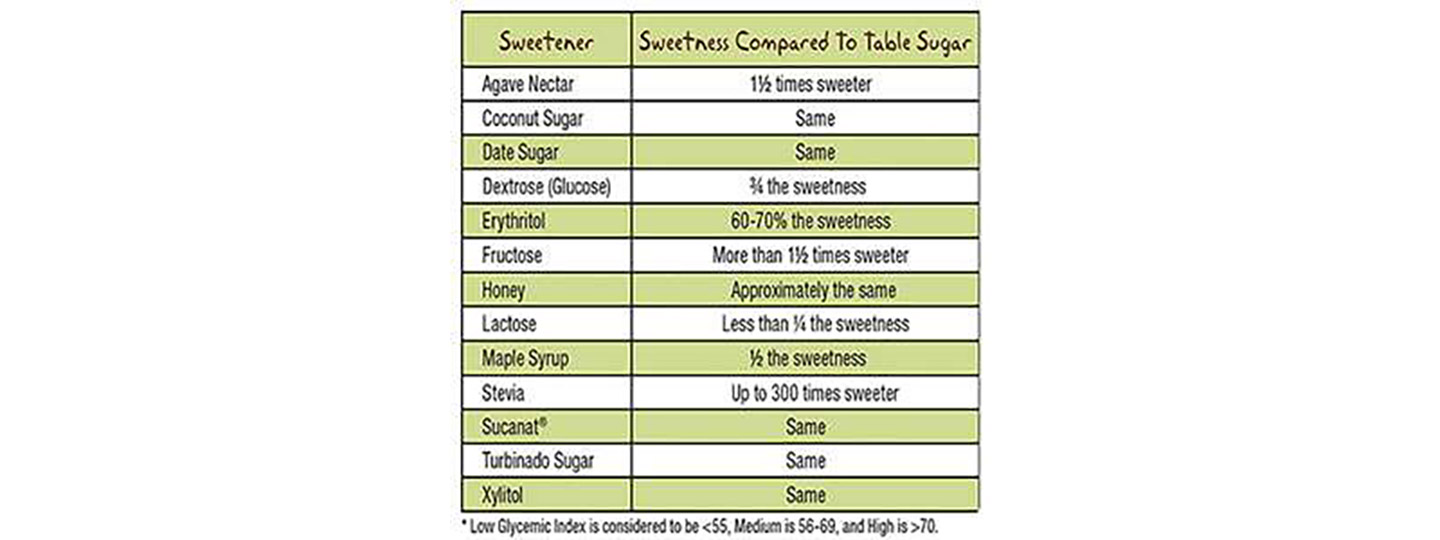
Our handy sweetness chart makes it easy to compare the sweetness levels of various NOW sweeteners compared to table sugar, as well as their glycemic impact. In this table you’ll find two different glycemic measurements – glycemic index and glycemic impact.
Glycemic index measures how different types of carbohydrate-containing foods raise blood glucose levels within two hours of ingestion. Low glycemic index is considered to be less than 55, medium falls between 56 and 69, and a high glycemic index is a rating of 70 or more.
Glycemic impact is a more consumer-friendly method of rating foods based on their effect on blood glucose levels, using low, medium and high to rate the overall glycemic impact of various foods.
| Sweetener | Sweetness Compared To Table Sugar | Glycemic Index | Glycemic Impact* | Keto Friendly |
|---|---|---|---|---|
| Agave Nectar | 1½ times sweeter | 10-19 | Low | |
| Coconut Sugar | Same | 35-42 | Low | |
| Date Sugar | Same | 103 | High | |
| Dextrose Sugar | ¾ the sweetness | 100 | High | |
| Erythritol | 60-70% the sweetness | 0 | Low | ✓ |
| Fructose | More than 1½ times sweeter | 19 | Low | |
| Honey | Approximately the same | 50-80 | Medium to High | |
| Lactose | Less than ¼ the sweetness | 46 | Low | |
| Maple Syrup | ½ the sweetness | 54 | Low | |
| Monk Fruit | 150 to 200 times sweeter | 0 | Low | ✓ |
| Stevia | Up to 300 times sweeter | 0 | Low | ✓ |
| Sucanat® | Same | 65 | Medium | |
| Xylitol | Same | 7 | Low | ✓ |
| *Low Glycemic Index is considered to be <55, Medium is 56-69 and High is 70 and greater. | ||||